|
A note to mobile/tablet readers that this blog is best viewed in landscape mode

This blog post will be Part 1 of a 2 part series on a data visualisation I created. Part 2 will detail the methodology and process taken to create this visualisation. So, read on and stay tuned later for the second post related to this visualisation.
This dataset was pretty interesting that I did spend part of my New Years Eve on this data visualisation. The other reason for this is because it was in response to a data challenge for one of the job applications that I submitted. This is an open dataset provided by the recruiting company based on the Steam dataset located here (https://steam.internet.byu.edu/). I would like to take this opportunity to mention that any data artefacts used and produced on my website will be based on open data or data that I have obtained rights to reproduce.
Embedded below is a dashboard as published on my Tableau Public portfolio which is slowly expanding: Link for mobile/tablet readers 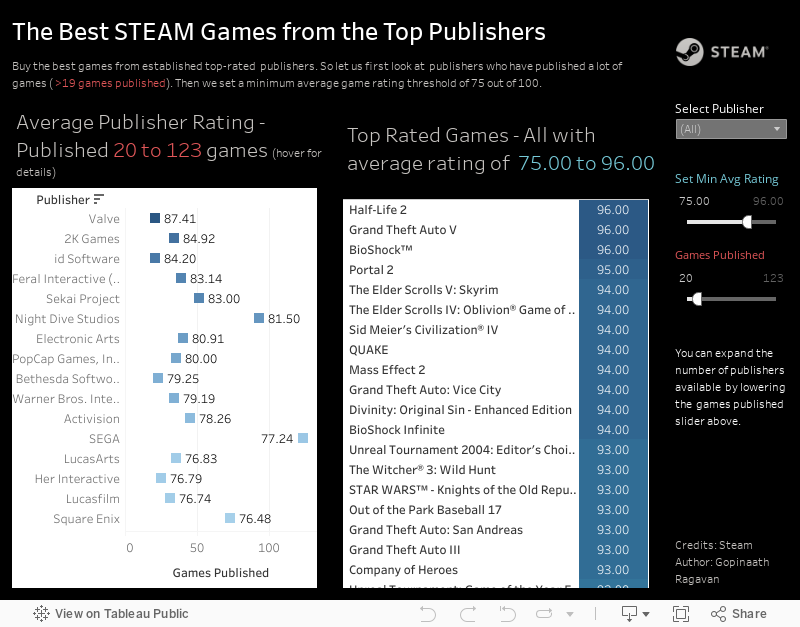
Stay tuned for more details on this visualisation
Comments are closed.
|
From The EditorWelcome to my Vizard of Oz blog. The name Vizard is a play on the word viz (short for visualisation) and wizard. As an Australian blogger who loves data visualisation, this blog has been fittingly named Vizard of Oz. Topics that I will talk about include all things data but will focus particularly on data visualisation, data engineering and predictive analytics. 
ArchivesCategories
All
|
 RSS Feed